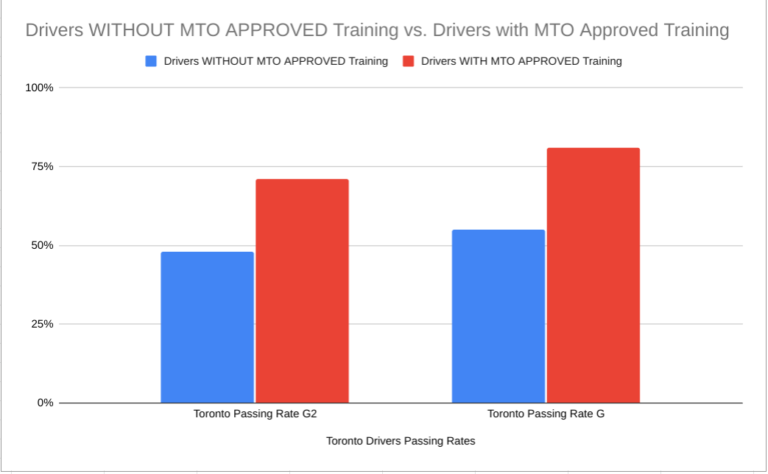
The following graph exhibits the passing rates of drivers who have had MTO-approved Training versus those who do not have MTO Approved Training. The statistics for both the Ontario G2 and G tests are applied.
The legend shows that the Blue Columns represent without MTO Approved Training.
Red Columns being with MTO Approved Training.
Source i.e. Toronto Downsview rates

Using N as the total number for G2 Drivers without MTO training, and G Drivers without MTO Training.
When the variance of the median is calculated, it is multiplied by 2 rather than divided for the Mode of Drivers who would have a MTO Approved Training.
For G2 Tests; Mode = 71% as shown in graph above.
For G Tests; Mode = 82% as shown in graph above.


